
Social media statistics are meant to address some important questions you may have as a marketer.
- How much should you invest in social media each day?
- Is Facebook really worth it?
- Are Snapchat Stories even real?
- What about Instagram stories?
These questions might sound silly, but they’re important to answer before you start your social media marketing campaign. In this article, we'll give you some stats on social media statistics, trends to give you better insight.
Social media is a major part of our lives. People post their daily activities on Twitter, Instagram and other platforms. From posting pictures to sharing links and comments, these networks enable us to connect easily across the globe.
Whether you're a startup or have been in business for years, you need to know to have a social marketing strategy to promote your business on digital media. We've compiled a handful of the most helpful social media marketing statistics.

Social media Usage Statistics
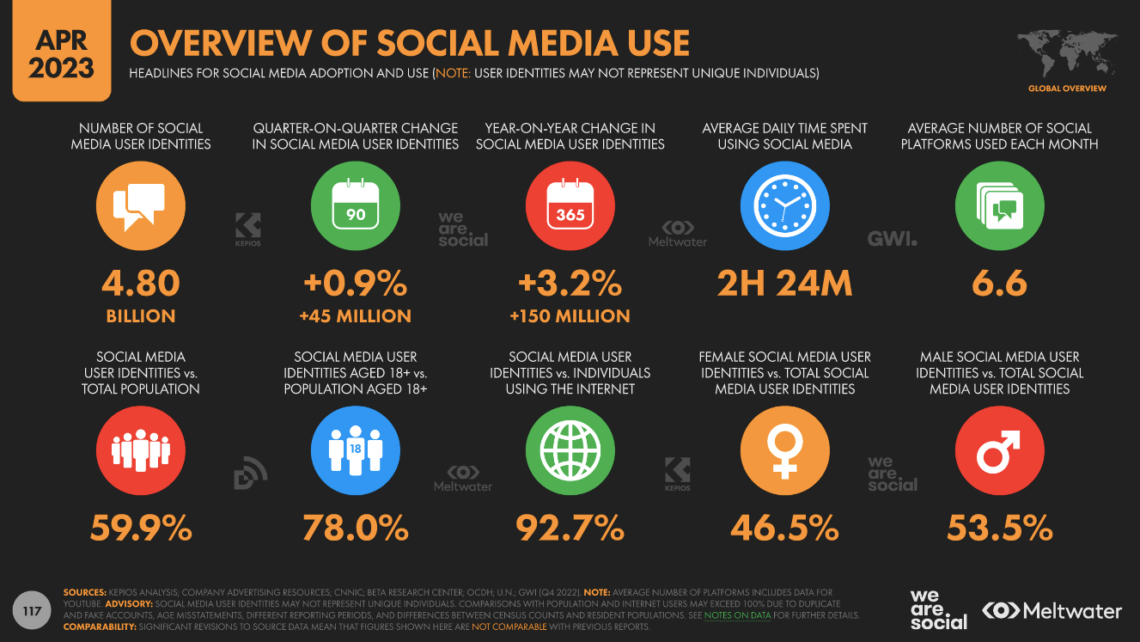
- As of June 2023, there are 4.9 billion total social media users across all platforms. This represents just over half of the global population and representing 93.4% of internet-connected people.
- Internet users are expected to spend more than 30% of their internet time on social media. This provides many opportunities to reach customers.
- Almost 60% of the world's population uses social media, and the average daily usage is 2 hours and 27 minutes.
A 2023 analysis of regional use of social media shows the wide variation of inactive social media penetration reaching 69% in Eastern Asia, 82% in North America, 79% in Southern America, and 85 and 84% in Northern and Western Europe respectively. This falls to 45% in Southern Asia, 16% in Western Africa, and 8% in Middle Africa.
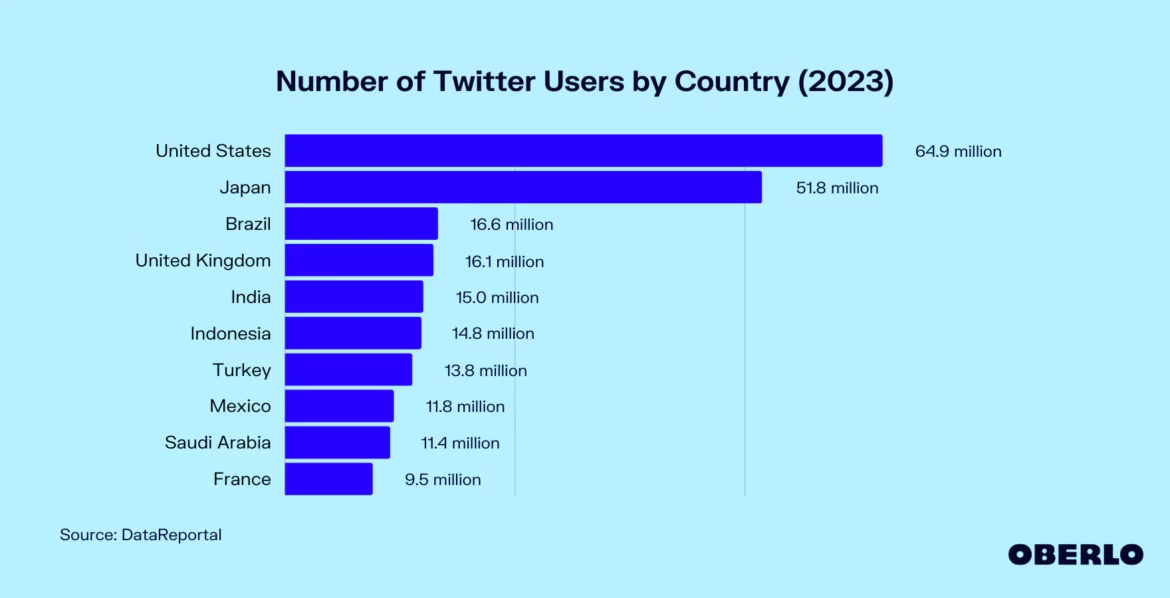
The United States is the country with the biggest Twitter audience size in terms of users. As recorded in October 2021, there were 77.75 million users in the USA, Japan with just over 58 million users, and India with 24.45 million users.
Most Popular Social Networks
Here's a list of the top most popular social networks of 2023 based on the number of monthly active users:
- Facebook - 2.9 Billion
- YouTube - 2.5 billion
- WhatsApp - 2 billion
- Instagram - 2 billion
- WeChat (Weixin) - 1.3 billion
- TikTok - 1.05 billion
- Facebook Messenger - 931 million
- Douyin - 600 million
- QQ - 591 million
- Sina Weibo - 566 million
- Telegram - 550 million

Facebook Statistics
Facebook is a social networking service that connects people with friends and others who work, study, and live around them. People use Facebook to keep up with friends, upload an unlimited number of photos, post links and videos, and learn more about the people they meet.
- In a HubSpot Blog poll, in 2021, 79% of marketers report buying paid advertising on Facebook.
- In January 2021, over 98 percent of active user accounts worldwide accessed Facebook with their mobile phone.
- India is the country with the most users on Facebook, with 340 million users on the platform, followed by the United States, Indonesia, and Brazil all of which have more than 100 million users each.
- As of 2022, Facebook usage and activity are at 33 minutes per day on average, which has reduced compared to the 39 minutes daily in 2017.
- Facebook is the most-used platform by marketers worldwide (93%). Instagram sits in second place (78%).
- Facebook is forecasted to have 254.26 million users by 2027 in the United States.
- Facebook Messenger was on track to reach 3 billion users in 2022. Now In 2023 there are 931 million monthly active users.
- Facebook Stories has 500 million daily viewers.
- Male users between the ages of 25 and 34 years make up the largest proportion (19%) of Facebook users. The followed by user base is male users in the 18-24 years age bracket.
- In 2020, Facebook generated almost $86 billion in revenue. About 75% of the revenue of that came from the Facebook app. The rest of the revenue was generated from displaying ad products on Instagram, Messenger, and third-party online properties (websites or mobile applications).
- Facebook is the world's third-most visited website with 1.62 billion users per day, 1.5 billion unique visitors, and 21 minutes 52 seconds of average time per visit.
- More than 200 million small businesses around the globe use its tools.
- 3% of Facebook users use it on desktop and mobile. 81% of Facebook users access the platform via mobile only. Facebook is used on the desktop by only 1.7% of its users.
Instagram Statistics
Instagram is a free photo and video sharing application available on mobile and desktops. People can upload photos or videos to our service and share them with their followers or with a select group of friends.
- India has the most number of Instagram users with over 201 million users base.
- Instagram has an engagement rate that is about more than six times higher than Facebook.
- Nearly 90% of people have revealed that an influencer has motivated them to purchase Instagram.
- Nearly 90% of marketers feel that Instagram is the most important platform for influencer marketing.
- Instagram shopping posts get 130 million user clicks per month.
- A survey of business-to-consumer marketers conducted in November 2021, found that 80 percent of respondents used Instagram for organic content distribution, and 47 percent used it for paid content distribution.
- 83% of Instagram users use the platform to discover new products and services. 87% of people even took a specific action, like making a purchase, after seeing product information.
- 51.8% of Instagram users are male.
- 48.2% of Instagram users are female.
- Instagram is most popular with households that have an annual income of more than $100,000.
LinkedIn Statistics
LinkedIn is the world's largest professional network on the internet. You can use LinkedIn to find the right job or internship, connect and strengthen professional relationships, and learn the skills you need to succeed in your career.
- Linkedin ad revenue exceeded $1 billion in 2021, which is a 37% growth from the previous year. The platform’s organic session engagement grew by a record 22%.
- LinkedIn has one of the highest-earning and most educated bases on social media. About 51% of the users are college-educated and half of the users earn more than $75,000 annually.
- Long-form content (in other words posts that are about 2,000 words long) performs better than short-form content on LinkedIn. The longer the LinkedIn post, the better it performs.
- The country with the most LinkedIn members is the US, followed by India and China.
- Once a LinkedIn business page has gained 150 followers, it’s the growth opportunity becomes exponential.
- More than 57 million businesses and 120,000 schools have LinkedIn social media accounts.
- Nearly 80 job applications get submitted every second on LinkedIn. On average, this comes to more than 200 million job applications per month.
- All in all, B2B marketers prefer LinkedIn for their organic content marketing. Most marketers also consider LinkedIn as the platform with the best content marketing results.
- Marketers reached almost 790.4 million users with LinkedIn ads, in October 2021.
- LinkedIn is more popular with men, who comprise 57% of its user base, as of January 2022.
- Millennials make up over 59% of LinkedIn’s user base, with 11 million of the 87 million millennials in decision-making positions.
- LinkedIn is the world's largest professional network with more than 830 million members in more than 200 countries and territories worldwide.
Twitter Statistics
Twitter is a social networking and microblogging service, which enables registered users to read and post short messages called tweets. Tweets are posted to a publicly available profile or can be sent as direct messages between users.
- According to HubSpot, 79% of marketers will continue investing in Twitter Spaces in 2022 and beyond.
- Research shows that tweets with hashtags receive 100% more engagement. Tweets with hashtags increase their engagement by 100% for the individual and 50% for brands.
- In the most recent report, Twitter's total worldwide revenue amounted to over 5 billion US dollars, up from 3.72 billion US dollars in the previous year. This is the largest increase in annual revenue that the microblogging platform has seen in recent years.
- 93% of Twitter community members are open to brands getting involved in a conversation, such as providing help and support.
- “#DigitalMarketing” (47%) is the most popular marketing hashtag among #ContentMarketing Tweets, followed by “#SEO” (40%) and “#marketing” (37%).
- Twitter has the second-highest educated user base in America, after LinkedIn. 33% of Twitter’s audience have some college, and 25% are in the high school or less cohort.
- 85% of Twitter’s audience earns more than $30,000 annually and 34% earn $75,000 or above annually.
- In 2020, Twitter’s Penetration Rate in the UK Was 45%.
- When looking at its audience worldwide, data shows that Twitter has 396.5 million users.
- Twitter sees about 206 million daily active users.
- 54% of Twitter’s audience are more likely to purchase new products.
- People Tweet about soccer more than any other sport. About 70% of Twitter users said they regularly watch, follow, or are interested in soccer.
- There are over 500 million Tweets sent per day. Broken down even further, that equals 6,000 Tweets per second, 350,000 Tweets per minute, and around 200 billion Tweets per year.
Pinterest Statistics
Pinterest is a visual discovery engine for finding ideas like recipes, home and style inspiration, and more.
- According to Pinterest, 7 in 10 Pinners say that Pinterest is their go-to place to find products or services they can trust.
- Pinterest users are seven times more likely to claim the platform is more influential than any social media platform in their purchasing journey.
- Approximately 50% of Pinterest’s total users are classified as “light” users, accessing the platform weekly or monthly versus daily, a cohort that is only 7.3% considered “heavy” users.
- 31% of US adults claim to be Pinterest users, which puts the platform between Instagram (40%) and LinkedIn (28%).
- 38% of Pinterest users are between the ages of 50 and 64, representing the largest age demographic on the platform.
- Women make up 60% of Pinterest’s core audience, and male users make up 40%.
- Pinterest ad spending has grown to $94.7 million annually in 2021. This growth is significant compared to 2020’s total spending of $30.3 million.
- 45% of social users in the US with a household income over $100K are active on Pinterest.
- In the first quarter of 2022, Pinterest recorded 433 million monthly active users (MAUs) worldwide, a 2 million increase in users from the previous quarter.
- According to Pinterest, Gen Z users adopt new products at 3.7x the rate of Boomers who aren’t on the platform.
- Video Pins are playing an increasingly important role on Pinterest, they have increased 200% year over year.
TikTok Statistics
TikTok is a popular social media app that allows users to create, watch, and share 15-second videos shot on mobile phones. With its personalized feeds of quirky short videos set to music and sound effects, the app is notable for its addictive quality and high levels of engagement.
- On TikTok, influencers with less than 5k followers see the highest engagement rates at 17.9% compared to macro-influencers with up to 1 million followers who get a 13.48% engagement rate.
- In 2023, HubSpot’s Blog poll (of 1,000+ global marketers) showed that 53% of marketers leverage TikTok and plan to increase their investment in TikTok marketing in 2022.
- Douyin, TikTok's original standalone app in China, had 300 million users at the time Musical.ly merged with TikTok in 2018 and recorded 1 billion users in 2021.
- In 2020, there were over 106,000 TikTok influencers worldwide, up from 35,000 in 2019.
- TikTok reached this impressive figure despite still being blocked in India, which accounts for more than 650 million internet users.
- In July 2021, Adult Swim –the programming block shown on Cartoon Network at night and targeting adult audiences– was the fastest growing brand on TikTok.
- The number of mentions of the Adult Swim brand (on TikTok) has increased by 1,787.5 percent compared to the number of mentions reported in June 2021.
- In 2021, users worldwide spent approximately 48 percent more hours per month using TikTok than in 2020.
- 16% of marketers claimed to use TikTok in their marketing in 2020 and in 2022 the number was 68%, a big growth in just 2years.
- In 2024 TikTok's Ad revenue is expected to overtake Youtube Ad revenue with an expected $11 billion.
YouTube Statistics
YouTube is a free video-sharing website that makes it easy to watch online videos. You can even create and upload your videos to share with others. Created in 2005, YouTube is now one of the most popular sites on the Web, with visitors watching around 6 billion hours of video every month.
- Google purchased YouTube for $1.65 billion back in 2006.
- According to Statista (2022), over 2.6 billion people worldwide use YouTube once a month.
- YouTube’s global advertising revenues are estimated to be $6.8 billion in the first quarter of 2023.
- YouTube is the second-largest search engine in the world.
- HubSpot research shows that 44% of marketers plan to leverage YouTube for the first time in 2022.
- India has the most YouTube users in 2022, and they are estimated at 467 million.
- In 2020, the biggest advertiser on YouTube was Apple Inc, with a spend of $237.15 million.
- In 2023, YouTube Premium and YouTube Music together report having more than 80 million subscribers around the world.
- In 2020, viewers spent 100 billion hours watching gaming content on YouTube.
- YouTube is the most used social platform for research among B2B decision-makers with 50.9% of users.
- T-Series is YouTube’s most subscribed channel with 244 million subscribers, while the channel which generated the most revenue in 2021 is Mr Beast with 149 million subscribers, the most for any individual youtuber.
Social media Advertising Statistics
- Retargeting ads are the most used among marketers, with 77% of marketers saying they use retargeting as part of their Facebook and Instagram advertising strategies.
- For 86% of Americans, transparency on social media is extremely important and they will take their business elsewhere if a brand refuses to show transparency.
- According to a survey released in November 2021 and conducted among B2B and B2C marketers in the United States, Australia, Canada, Germany, United Kingdom, France, and Japan, 21 percent of respondents said that Facebook was the social media platform with the highest return on investment (ROI) that year. Instagram ranked second with 18 percent of respondents, followed by LinkedIn with 14 percent. TikTok ranked fourth with 12 percent, while YouTube ranked fifth with 11 percent.
- In 2022, the forecast for Facebook digital advertising revenues saw the Meta Company generating 136 billion U.S. dollars by the end of the fiscal year. TikTok was projected to see its online advertising revenues hit 5 billion U.S. dollars. By comparison, Pinterest's advertising revenues were forecasted to reach approximately 2 billion dollars in 2022.
Social media Consumer Behavior Statistics
- Globally, there are 5.29 billion unique mobile users, which means that more than 60% of the world’s population now has access to a mobile phone.
- For 43% of all internet users, social media is a major source of information on what to buy. It is also a great way to learn about new products.
- Of all social media content types, video is considered the most transparent content type by 67% of consumers. In relation, 43% of consumers believe that live video is the most transparent form of content creation.


